Recap of the 24th Annual Virginia GIS Conference

By: Jonah Adkins

virginia gis conference

The 24th Annual Virginia GIS Conference was held Tuesday, September 17th, 2013 in historic Williamsburg, Virginia. The event was sponsored by VAMLIS, the Virginia Association for Mapping and Land Information Systems, and was attended by around 250 GIS practitioners from across the state of Virginia.

I had the pleasure of attending the conference, along with a few of my GISi colleagues: Anthony Scardino, Melinda Dubaj,  John Martin, and Marvin Garland.  The conference provided a great networking atmosphere to catch up with old colleagues and meet up and coming professionals, as the attendees ranged from college students to private sector to state and local government officials.  Dan Widner, from the VGIN (Virginia Geographic Information Network) kicked off the morning with a keynote on the future of GIS within the commonwealth, and was followed by a round of lightning talks, among those, a great overview of the Virginia Broadband Initiative by Michael Edwards of VITA (Virginia Information Technologies Agency).

There were over 40 sessions offered throughout the day, which covered a wide variety of topics. Highlights from the ones I attended were:

  • Jackie Stephan of The City of Newport News discussed tracking energy usage within its offices.
  • Mark Mandell of VDOT (Virginia Department Of Transportation) showed how they tracked snow plow progress via a mobile application and web mapping application during snow events.
  • Andrew Becker displayed results from his Masters project on the predicting Amphibian Breeding Pools.
  • Mike Sweeney from Esri gave a deep-dive into ArcGIS Online and the entire ArcGIS Platform.
  • Chris Gerecke talked about improving user experience in application design.

Lastly, David Wells, the president of VAMLIS awarded some door prizes provided by the conferences sponsors as well as, announced the winners of the map gallery at the college and professional level. A conference sponsor also hosted a short reception afterward that provided a great book-end to day’s events.

An Overview of the Interactive Atlas of Heart Disease and Stroke

When we worked with the Center for Disease Control and Prevention (CDC), to build the Interactive Atlas of Heart Disease and Stroke, we knew it would serve as a great resource for anyone wanting geographic and demographic information related to heart disease and stroke.  Their goal was to provide public health leadership to improve cardiovascular health for all.  And the atlas would help identify places that bear the greatest burden of cardiovascular disease and potential causes, an early step towards tailoring resources and interventions to the needs of specific geographic areas.

The project goals were to provide a new internal and public access interactive web mapping application for the display of heart disease and stroke data as well as their risk factors and related data.  This involved an improved user interface experience and simplified data management.

With over 20,000 hits since January from all 50 states and 100 countries, the project is a success. To recognize the CDC’s dedication and work to help prevent heart disease; Esri presented them with the 2013 SAG Award at their Annual User Conference in San Diego.

Recently, researchers at the CDC published a report showing that out of 800,000 cardiovascular deaths each year, as many as 200,000 of the deaths could have been prevented if people had made health-related improvements to their lifestyle.  But one thing the report noted was that the rates of preventable death from heart disease and stroke were highest in the South, indicating that longevity may have more to do with your ZIP code rather than your genetic code.

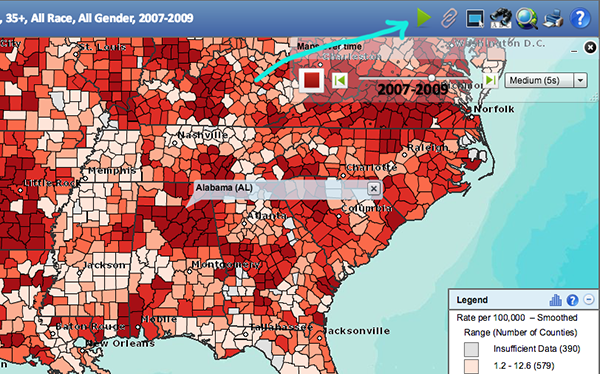
With the highest rates of preventable death from heart disease and stroke concentrated in the South, it’s easy to visualize this finding within the Interactive Atlas application.  The map below represents the report’s findings.

atlas

The map allows users to select geographic areas to view, either by state, U.S. map with state data, or U.S. map with county data with the ability to pan and zoom to specific areas of the map.  Various health Indicators can be selected if users want to view map data based on all heart disease, coronary heart disease, acute myocardial infarction, cardiac dysthymia, heart failure, hypertension, all stroke, ischemic stroke, hemorrhagic stroke, and preventable/avoidable death.

Users can then filter by race/ethnicity, gender, age, year, and spatial smoothing.  Other options can be selected to display on the map including determinants of health, for example social environment, race/ethnicity, and physical environment.  If a user wanted to view available health services on the map like hospitals and pharmacies, they have that option.  Users can also overlay the map to show healthcare facilities, roads and cities, and other boundaries.

Another useful feature is the ability to view two maps side-by-side for the purpose of comparison.  So if you wanted to visualize the heart failure death rate in Alabama for men versus women, you could easily switch it to view one map showing data for men and another map showing data for women.

side by side

And if that isn’t enough of a cool feature, the map has the ability to animate so that users can view historical data over time.  This is achieved by clicking the play icon on the map toolbar, shown in the screenshot below.

map animation

What’s intriguing about the interactive map, is not only what it shows, but the technology behind it. The CDC atlas is a Flex application that consumes map services from ArcGIS Server 10.  The data is housed within SQL Server.

The application also consists of a web service (WCF) that provides health and demographic data, which is dynamically bound to spatial boundaries on the client.  The Flex app loads the county and state boundaries during startup and retrieves health and demographical data from the web service, as needed per the criteria chosen by the user.

The app also uses a custom configuration schema that allows for easy updating and maintenance of the data by CDC.

It is exciting to see this application put to great use and really providing that spatial insight that makes it a little easier to understand the new reports the CDC released to the public.  And since we’ve spent enough time playing around with the application and zooming in and out of areas on the map, namely our hometowns, we’re thinking it’s time to start making some health improvements.  Maybe company meetings on the b-ball court?  Could be a start!

Designer Insight for Developers: A series of tips to help developers improve their interfaces

By: Lea Puckett

know thy people

Being the sole designer in a company our size can be a daunting task. With 100’s projects, I’m not always able to jump in and help when there are interface woes. I’ve been wondering for the past several months how I can make a bigger impact without going through the awkward process of cloning myself.

After our company meeting, Unplugged, it came to me. I needed to take the approach of working smarter rather than harder. In this instance, it means I need to share more of my knowledge, rather than piling on more projects. So this post marks the beginning of my knowledge transfer to developers who want to enhance their interface design skills.

Know Thy People

Typically, this is called “Know Thy User”, but I’ve changed it to people. I believe using the generic term user removes emotions from the equation, which is wrong. People use our applications and people are emotional creatures. It’s in our best interest not to forget this crucial point.

You need to get an understanding of the people who will be using your application by any means possible. Conduct interviews. If you can’t talk to people in-person or via phone, talk to someone who can give some insight. Some information, even secondhand, is useful. Gather whatever data you can find. Be it Google Analytics reports, 3rd party resources, or internal analytic reports. Perform user tests. If a system already exists, gather some users and run them through some of the core tasks the application does. This can be done in-person or remotely. There are several tools out there that can help you out with recording sessions remotely and locally so you can share with a broader group.

If it’s a new application, get wireframes in front of the users, so you can get feedback as soon as possible. The sooner you catch issues, the easier and cheaper they are to change. Don’t worry about things being polished. People like to be involved in the process and see their feedback acted upon.

After all of this curating, you should have a better understanding of how your people differ, what their goals are, what their needs are, how they think, and how they feel. You will begin to see trends/similarities between them, which will provide you with natural groupings. By having these groups to design for, this allows you to focus on the important features that meet the needs of the group instead of random individuals. This makes your job easier.
You maybe be uncomfortable with conducting interviews/talking with strangers and tempted to skip this part, please don’t. You will end up creating something that you “think” is what they want, but the flaw there is it’s your thoughts not the people who will be using the application. So boldly go where you haven’t before and get out there and talk to people!