Delivering Service Excellence When Things Go Wrong

business meeting

By: Keith King

If you provide a product or service, things will invariably go wrong.   A deadline will be missed, the product will break, or an expectation won’t be met.  It goes without saying that we must direct most of our attention toward doing what we say we will do.  If we continuously miss commitments and make it hard for our customers to do business with us then we won’t be a business for long.  However, how do you continue to deliver service excellence when thing go wrong?  Here are a few thoughts:

Run Into the Fire

It is often tempting to avoid the conflict or dance around the issue at hand.  This just makes things worse in the long run.  As the service or product provider, begin the process of dousing flames of anger and disappointment with blunt truths and full disclosure.  This may cause the flame to flare up temporarily, but in the long run you will build trust and have a much better chance of salvaging the relationship.

Tell the Truth

Do you want to do business with a liar?  Enough said.

Bad News gets Worse with Age

When you know there is a problem, tell the customer sooner rather than later.  Don’t try to buy time.  Getting out in front of the issue helps you minimize the impact on the customer and gives you a better chance of developing a joint solution.  Obviously, our customers don’t need to know all the gory details behind the sausage making process.  However, when you know something is going to go completely off the rails, err on telling the customer.

Change your Shoes

We are in business to serve our customers…so serve.  That means that we need to set aside our own self-interests and look at the situation as if we are in our customers’ shoes.  Have empathy and work hard to minimize the impact on your customer first and yourself second.

Show up

When things really go bad, get in your car or buy an airplane ticket and go see your customer in person.  This is one of those running into the fire actions.  It won’t be fun, but good things usually happen when you go see customers.

Take the Opportunity to Keep your Mouth Shut

When things go wrong, there usually is plenty of blame to go around.  This isn’t the time to blame the customer.  Let your customer vent.  Hear what they are saying.  When they are done, begin the process of building a plan for resolution.  If you try to start working on the plan too early, or (even worse) you insist on pointing out what the customer did wrong you are only going to meet resistance.  Give the customer some time to “get it off their chest”.   There is a time for everything under the sun…but this is the time to shut-up and listen.

Leave the Contract in the Drawer

When the contract comes out, you are way past the point of delivering service excellence.  You are trying to win a battle. So you have to ask yourself a few questions:  Is this a customer you want to have a long-term relationship with?  Do they have a point?  Did you mess up?  If the answer is yes, then leave the contract in the drawer.  Pulling out the contract turns the situation into a legal issue and it hurts your ability to salvage the relationship.  There will invariably be times where you have disagreements on project scope or a product’s capability; however, whenever possible, deal with these disagreements through ongoing expectation management and discussions…not the terms and conditions.

Make Bad News Good News

Let’s say you have decided to trade in your 5-year-old car and buy a new one.  Let me ask you a question on these two scenarios:

Scenario One/Dealer One:  The car you currently own has performed great.  You have had 5 years of trouble-free service with the car and the dealer you purchased it from.

Scenario Two/Dealer Two:  Five years ago, shortly after you bought your current car something went wrong.  In fact it went wrong because the dealer messed up.  You were disappointed and livid and you let the dealer know.  The dealer, however, listened to your issue, admitted their mistake, and fixed the problem.  In fact they exceeded your expectations in the process of fixing the problem.  You got the car back and have driven it for 4.9 years of trouble-free service.

So my question: who are you going to buy your next car from, Dealer One or Dealer Two?

I bet you picked Dealer Two.  At first, this might seem illogical because, after all, at some point in the experience you were very upset with the dealer.  However, they made it right.  We inherently know that it is impossible for things to always go as planned.  And when they do go wrong, we want someone to be there to own and fix the problem.  My point is to be like Dealer Two when things go wrong.

Let me reiterate, compensating for poor operational or product performance by getting good at begging for forgiveness is not a business strategy.  It is a bankruptcy strategy.   We have just a few chances to recover from our mistakes.  If we can’t deliver, the customer might think we are a nice person/company, but they will eventually dump us for someone who is competent.

In my years of working in complex and highly technical service oriented industries where things often go wrong, I have learned the above concepts through the school of hard knocks and from some very intelligent and street-smart people.  To include my buddy Mike Sorrentino, Jim Morgan, a former CEO of Applied Materials, Roger Cameron from Cameron-Brooks, and several “salty” bosses from Navy and private industry – Thanks for teaching me these concepts folks.  They have served me well.  For those reading this article, I hope they serve you well too.
Estimating the ROI of a GIS (Geographic Information System) Solution for Location Analytics

By: Tim Calkins

If your organization is evaluating the feasibility of a GIS solution or already has a mature Location Analytics platform, calculating the derived benefit to the bottom line is powerful and constructive exercise.  The goal of this post is to help build the business justification with ROI (Return on Investment) as the quantitative yardstick for measuring the cost/benefit and value achieved from a GIS solution.

There are many tangible and intangible benefits derived from the problems a GIS solution will solve.  Qualifying and quantifying the results of the ROI exercise and then documenting them is a common practice and many tools are available to assist with the calculation.

Building the business case

A business case is best described as a financial story based on facts, structured assumptions, and logic. It provides a vehicle by which the financial impact of the options can be examined and conclusions drawn.

Example:

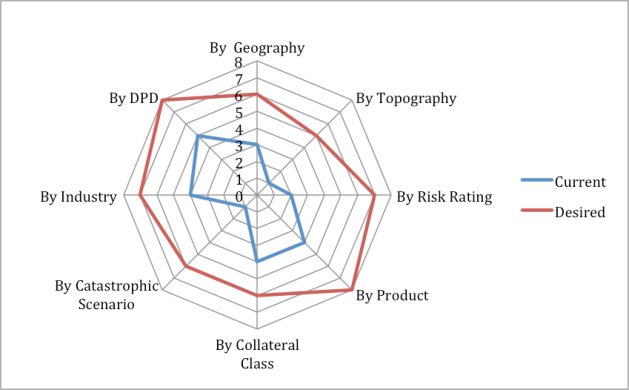
A bank wants to analyze its customers and loans by location, product, industry, risk and risk exposure.  The bank would like to assist a manager’s ability to visualize their accounts in an easy to use dashboard.  After review of their capabilities, a spider chart was produced with current and desired functionality.

GIS ROI Graph

Visualize Customers Current Desired
By Geography

3

6

By Topography

1

5

By Risk Rating

2

7

By Product

4

8

By Collateral Class

4

6

By Catastrophic Scenario

1

6

By Industry

4

7

By DPD (Days Past Due)

5

8

The bank had considerable gaps between where they were and where they desired to be as an organization.  They wanted the ability to overlay a map of customers along with a hurricane’s path or see what customers or facilities are within 25 miles of the San Andreas Fault or below 25 feet above sea level along coastal areas.  Working with senior management, gaps were prioritized and then assigned a value.  Results were tabulated and reported back to senior management using a standard ROI template.

The above use case has been oversimplified but building justification can be boiled down to a few basic steps.  The outline below uses a five-step process derived from standard practices around calculating ROI.  These steps were adapted from “The Business Benefits of GIS: An ROI Approach” but summarized for a more agile approach.

The 5 steps are:

  1. Determine the need and benefits of a GIS solution
  2. Outline and prioritize business requirements and opportunities
  3. Assess budget and project timelines
  4. Estimate benefits
  5. Document and present results

Step 1 – Determine the needs and benefits of a GIS solution

Does your GIS solution align with your organization’s strategic objectives?

The first step in calculating your ROI will involve looking at what’s driving the need of a GIS solution.  You’ll need to assess your organizational pain points and weigh them against your goals and objectives.  During this step you must consult crucial stakeholders and identify the improvements and benefits of a GIS solution.  Key decision makers must be identified and should be made aware of the ROI study.  Their involvement and approval is crucial to the ROI process

Step 2 – Outline and prioritize business requirements and opportunities

Defining the scope of the project is next.  Getting agreement on what problems the GIS solution will solve and the functionality needed, along with knowing what is nice to have versus what you need to have, should be documented.  The pain points should be objectively laid out and prioritized with the end users and business partners.  Also you should outline the opportunity costs and what the risks are of not having a GIS solution.  The intangibles are much harder to quantify but a value should still be placed on them.  Critical objectives should be benchmarked for a before and after appraisal.

Step 3 – Assess budget requirements

After the scope of the solution is agreed upon, the cost of the project should be estimated.  The steps are the same if the GIS solution is already in place and you are just adding features or functionality.

The ROI model allows you to break out the elements associated with the specific projects in your portfolio to allow comparison between the benefit value of a calculated base case without GIS and a calculated case with GIS. To complete the template, it is necessary to revisit the original opportunity list.

Step 4 – Estimate benefits

In order to estimate a type of return on an investment in location analytics, a value must be assigned to derived dividends of the solution.  Mapping out capabilities at the start (current) of the project and what’s expected to be achieved (desired) allows you to see the “gap” and assign that gap a value.  Working with senior executives and your organizational goals, you should be able to team up and assess the value of reaching your desired capabilities.  It’s a great exercise to get buy-in and prioritize which capabilities add the most value.

There are many different ROI templates available for free on the web and you can dive as deep in the financial weeds as you want.  How deep is dependent on what level of detail your management requires.  Using these templates and mapping capabilities you should be able to use the estimated benefits to assign a quantitative value with the templates.  Based on the results of the analysis, it may be necessary to adjust the budget or seek additional examples of quantitative benefits that can be modeled in order to make a strong argument for GIS.

Step 5 – Document and present results

The final step will have you compiling your templates and creating reports with the purpose of demonstrating to senior management the value of funding a GIS solution for location analytics.  There are many different styles you could use to format your report but I suggest you start with an outline containing the following key components:

Executive summary It should be a high-level overview of your findings and a proposal for moving forward.  It should be written with your senior team leadership in mind.

Background and history – Describe the need or shortfall that started this project and why your organization decided to look at this type of solution.

Purpose and scope – Next you need to provide an outline of the justification for this project and a review of processes and capabilities.

Proposed project – The next step is to describeas the solutions to the problems outlined above.  It should be detailed enough to accurately describe what features and functionalities will be included.

Cost and time frame – The almighty budget and dollars will receive the most scrutiny.  Time frame and internal and external resources should be included in this section.  This is the most challenging section of the report and should receive the most attention.  If this part is not deemed accurate then it will put the entire solution in jeopardy.

Recommended action – The purpose of the final section is to summarize the results and make a recommendation to senior management that the program should be funded as proposed in the report. This final sec­tion should be very focused on your key arguments and should be no more than a few paragraphs.

Glossary of terms – The last section should content an appendix with a glossary of the terms used in your report.  Your glossary should include both GIS terms and ROI financial terms.  Most likely the report will be presented to both audience and there is a good chance that only readers will only know either financial or GIS terms, not both.  So it will be useful to keep everyone on the same page.

Summary

A positive ROI tells a compelling story, especially if the advantages line up with your organization’s mission and strategic direction.  Both tangible and intangible benefits can be achieved along with better access to data and improved quality of a data for decision-making.  Without ROI estimation, senior leadership can only focus on how much a GIS solution costs and not the organizational advantages. Estimating the value of your GIS solutions provides an effective framework and roadmap for the location analytics solution.

If your organization is about to evaluate a GIS solution, our team can provide help in calculating its ROI.  We offer a few free hours to help guide you on your project and get started in the right direction.  If you would like more information, feel free to fill out the form below and we will be in contact with you shortly.

Esri Dev Summit Wrap-Up

By: Dan Levine

Now that we have had the better part of a week to decompress from the Developer Summit and Partner Conference, I wanted to provide some final thoughts from our GISi team that attended. Even though I am more of a Jimmy Fallon fan, I will use the Lettermen Top Ten format to do this (I am not quite creative enough to put these into a Thank You note format).

1. Emphasis on Design UI/UX

This topic was introduced by the Keynote Speaker Jared M. Spool, who was hilarious while presenting a great topic. You can check out the video here.

As we transition from developing for the GIS User to the non GIS User – the user experience expectations have changed and we need to be more conscious about how we go about meeting those. Spool’s talk gave us a framework in which to do that. The UI/UX theme was scattered throughout a number of “best practices“ technical sessions and it had even seemed to spread into a best practice for code structure. All of Esri’s code that you saw was well written, organized, and followed best practices. Even in several dumbed-down examples, they still followed best practices even if it added a few lines of code.

2. Esri Stack Alignment – the Platform

OK, we get it, it’s a platform. Yay it’s about time. Seriously though, it is quite refreshing that the Esri stack now really all looks like the same software and it is up to industry standard specs too! That’s why we can call it a platform. You could see Esri building towards this over that last few years and it clearly didn’t happen without some pain and effort on their part. Way to go product teams and visionaries at Esri!

3. On a related note – New software Integration into the Stack

Esri has definitely gotten much better at integrating software that they have acquired. Note the GeoEvent Processor, Esri Maps for IBM Cognos, GeoTriggers, and CityEngine to name a few. It used to take years for Esri to truly integrate newly acquired software (remember Schematics). Now, outwardly at least, there seems to be process and consistency to incorporating these new components quickly into the stack. The fact that the stack has matured surely makes this easier. I am anxious now to see how they do with the developing new 3D capabilities with several teams scattered across the globe.

4. AGOL is getting pretty Deep

The central component to the Esri stack, AGOL (and portal for organizations) is getting richer by the day. An incredible investment in the types of data becoming available – increasing resolutions of imagery and elevation data, the effort to consolidate all of the natural resources data in the Landscape Services are just a few examples. Additionally, the application side is also getting deeper and wider. Addition of the GeoEnrichment component, exposing BA data/reports into AGOL is a nice touch. More importantly, adding SAML2 to the security component makes solutions built with AGOL more palatable to organizations that require Single Sign On – SAML2 lets you leverage the corporate AD/LDAP security infrastructure instead of requiring you to use your Esri Global Account credentials. Leveraging this capability is being pushed out to all of the SDKs that would tap into AGOL. Esri is still working out the business models and necessary infrastructure to allow us to develop apps that leverage AGOL and create some sort of charge back ability. How are AGOL credits accounted for? Adding an application ID tag and an AGOL Organizational ID tag is going to help. Two current models leading the way are the Apps for Organization, where you publish and application and with the app ID you can track how many credits that application uses. The next step would be to have a User ID so you could track at the user level who is using a particular app and how many credits they are using. The other model is more of a consumer type of solution. We create an application and make it available to the general public. The owner of the application pays for the credit usage and it is up to them if and how they charge the users for the credits used. Esri is figuring this out, as it will be key to rolling out the MarketPlace.

5. The “Geo-” prefix is still cool…but can lead to Geo-Confusion

Like what is the difference between GeoEvents vs GeoTriggers – stand by for a geo-whitepaper – Amber Case promised. There had been some movement away from using GEO that started last year as part of the Location Analytics Team and for good reason. These are the guys that are building the solutions that are embedded into the larger Enterprise IT stack and the C-level guys that manage those don’t generally speak Geo. But there seems to be this yin and yang going on within Esri about the terms. You could see it in the session titles: “Unleash the Power of Mobile location in Your Application”, “GeoTriggers” – basically was the same presentation by the same people. Conclusion: Geo is still cool, just be careful what you say around Art Hadaad.

6. ArcObjects is NOT going away.

So last year the thing was the Run Times. Everyone was trying to get up to speed on the run-times, learn about the architectures, what functionality it had and would have, etc. It seemed like we were being encouraged to move away from ArcObjects and jump on the RunTime Bus. By the end of the week, many of us started wondering what was going to happen to ArcObjects. Was RunTime Replacing ArcOjbects? How long did we have to migrate our apps? Finally, during the closing lunch Q&A someone asked. Well Jim McKinney and Scott Morehouse didn’t make us feel any better. They clearly weren’t prepared for the question and maybe the answer they gave was what they were thinking at the time. Yes, RunTime will be replacing ArcObjects but it will take several years (paraphrasing). Well this year both Jim and Scott were ready for the very same question. Answer, unequivocally “ArcObjects is NOT going away.” It is at the heart of the most robust desktop GIS Software in the world and will continue to be. Thanks for the clarity! I heard Neil Clemmons give a sigh of relief all the way back in Birmingham.

7. Run-Time Disconnected Editing is Almost Here

Many of us are being asked to develop mobile data collection apps that can stand being disconnected for periods of time. The run-time SDKs currently don’t support that workflow inherently. Some of us have built “work-around” solutions that are specific to our particular use cases, but the core products don’t have this capability. It’s coming with the 10.2 release with the “Synchronization Engine”. That was the message on the plenary and in the tech session. But…you kind of got the feeling that it might not quite be ready with the initial release of 10.2. Fear or uncertainty in the eyes of the product teams, I don’t know but my spidy senses were going off. It feels like one of those things that will be in the first post release soon after the main 10.2 release. That’s fine by me, just keep us informed of what is realistic and get it right before you get it out. This is a huge deal for many of us.

8. ArcScripts is Back … Can you say GitHub

Social coding is permeating GIS development. The ability to share and contribute to OSS is becoming more and more mainstream. Esri’s adoption of Git and GitHub as their tools of choice for sharing source code for certain solutions strengthen the importance, flexibility, and capability of social coding in general and Git and GitHub in particular. This is pretty important for those of us extending the starting point solutions that Esri publishes. It will allow us to create a branch ourselves and add our secret sauce and then opt or not to share it back to the community. Don’t expect everything to be shared though, for instance, the Military Solutions team has already posted many of their solutions source code, but the simply can’t do that for all of their solutions due to ITAR issues. In any event, this is a very nice use of the mainstream technology for sharing solutions in a really useful way. We are currently evaluating what we use for our own internal source control and this GitHub movement by Esri may now influence what solution we decide to go with.

9. ArcGIS Desktop integrated viewers and multiple Layouts almost here, that’s crazy talk.

Welcome back the ability to have multiple layouts in a project, a long time coming. But we still have a while to wait. Promising to be in the 11 release (maybe this calendar year) we will be able to have multiple 2D and 3D viewers in the same application. This has been something we have had to customize for several clients. Now we can plan to retire the custom solutions in lieu of Out-of-the-box capability and spend our time on what to do with that information.

10. Dodge ball is still the big draw.

I don’t know about the rest of you but is there anything else going on at the Wednesday night social? This year they had to go to 3 simultaneous courts. We fielded two teams but still couldn’t get past the quarter finals. Dang. I thought sure that at least we would win the best uniforms. You tell me. The winning team: Bright Orange Tees with the words Flying Dodgmen. Ok they were a Dutch team and wearing the country’s colors. We had Bright Orange Tees (road-worker orange) with zombies on the back. Waaay better graphics! What gives? I am starting to think there is a dodge ball conspiracy against GISi after we took out one of the Esri teams in the first round last year. Come on man!

GISi Dodgeball
In conclusion

This has always been, by far, the best technical “show” that Esri does and I evangelize attendance to our staff and anyone else’s staff for that matter. That said, this year it felt like it dropped off a bit in technical depth. Not sure that I can tie anything specific to this sense, but our entire team felt it and I had similar comments in a number of conversations with other attendees that aren’t part of the GISi family. Some of the comments were about the fact that a lot of it felt “salesy” or they were trying to push the Platform message across the board so much that there wasn’t as much Deep Dive into the code. Usually a Tech Session presentation would start with a Title Slide and then we would be looking at code. This year it was Title Slide, How X fits into the Platform, a reminder what the platform is, where you can find this on GitHub and the developers.arcgis.com site, then a bit of code. I get that the messaging is important and that there is a shift in the Esri philosophy on what they are creating and promoting and even who they are promoting it to and that that needs to be communicated. All that aside, still I am talking a B for the show versus a consistent A to A+ that it scored in the past. We will be there next year, maybe with enough to field 3 dodge ball teams.

Esri Developer Summit – Highlights and Commentary

Last week, we sent ten of our employees to the Esri International Developer Summit in Palm Springs, CA and they produced a recap for each

Photo courtesy of Esri

day of the sessions and plenaries they attended. Each recap is broken down from Day 1, Day 2, and Day 3 with highlights and then a more in depth write up from each developer. In total we produced over 17,000 words recapping three days from the conference!

We thought we would share with you some of the best highlights of the three days we spent in sunny California
The Anatomy of a Design Decision
The second day at the Esri Developer Summit kicked off very strong with an excellent, thought-provoking, and humorous presentation on “The Anatomy of a Design Decision” by keynote speaker Jared Spool. The question of how design decisions are made is an important one and was the focus of the presentation. There were no non-decisions we learned, just a spectrum of five design decision styles. Jared introduced us to new terminology specially crafted to explain these five styles of design decisions and when each “works great”.
Read more from Ryan on the keynote from Jared Spool

ArcGIS Online is Like Flickr
You can think of ArcGIS Online as the Flickr of Geospatial content. It provides an ever-improving mechanism for viewing, editing and analyzing data. Just like Flickr I can define using groups, user credentials, and even active directory authentication to determine who can access my data. This assuaged a lot of my initial concerns dealing with security and access to sensitive information like property records.
Read More from Christopher on ArcGIS Online

Caching Capabilities in ArcGIS 10.1
Caching capabilities are enhanced at 10.1, notably in that the process of creating the cache has been decoupled from the map service itself. It can be done in the background without locking up the map service…just great for up-time! Also some great techniques were demonstrated for using non-production server resources to update cache consumed by production services.
Read more from Caleb on caching with ArcGIS 10.1

Learning About Esri UI Process
I learned a surprising amount from the presentation that discussed Esri’s UI design process. When they showed the video of how a user interacted with a prototype of an Esri product…I was impressed by the sheer amount of information gleaned from that process! Using a process of interview and interrogation, Esri was able to make very simple and significant changes to their “Community Maps” application. The recorded videos captured where volunteers clicked and thought information should be provided. The final result was surprisingly powerful compared to the very similar previous versions.

Read more about what Chris learned about Esri UI process

Enjoy!